|
Seismic OceanographyIn early 2003, I was privileged to review the first, seminal paper on SO (Holbrook et al. 2003). This paper showed that sound reflects strongly enough from thermal structures in the water column that the reflected sound could be used to determine the size, location, and temperature contrast of the features. This meant that multichannel seismic observations can image fine-structure within the oceanic water column with unprecedented (~10m) resolution. On the basis of my enthusiastically positive review I was asked to write a Science Perspectives article (Ruddick, 2003) on the prospects for this new tool. I noted that the seismic images are analogous to satellite images, giving lots of detail, but working best when combined with quantitative physical oceanographic observations. I was also interviewed by Deutschland Radio on the same topic ("Forschung Aktuall", 12-08-2003). Ruddick et al. 2009, showed how seismic reflection images vertical temperature gradient averaged on scales of 5-10 m, exactly the quantity oceanographers would like detailed maps of in order to show the fine structures related to mixing phenomena like intrusions and internal waves.
I took part as a foreign participant in the large EU project "Geophysical Oceanography", leading to many collaborations, past and present, with the Prof. Luis Pinheiro.s group at the University of Aveiro, Portugal. We are imaging Meddies, fronts, currents, and other structures using the technique, and doing our best to learn new quantitative things about ocean mixing.
Collaborations in this new field continue to expand. I was invited to attend and give two keynote lectures at an EU-funded Workshop on Seismic Oceanography in Begur, Spain, November 2008, a small Gordon-Conference-like meeting with about 80 participants. I was recently invited to take part as a foreign participant in a new EU project (POSEIDON) on Seismic Oceanography based in Barcelona, Spain. Dr. Berta Biescas, of the Unitat de Tecnologia Marina in Barcelona, Spain, was recently awarded a Curie Fellowship to come to Dalhousie in 2011-2013 to work with me and Mladen Nedimovic. The focus of the project is quantitative inversion of seismic data to obtain temperature and salinity using seismic observations. to remotely infer thermohaline structure in the water column. A group of us at Dalhousie and BIO successfully intercompared seismic and hydrographic observations South of Nova Scotia. The objective was to "ground truth" a Multichannel Seismic survey with detailed oceanographic observations. Mirshak et al (2010) give a detailed comparison of seismic images from the Gulf Stream frontal region with hydrographically-derived synthetic images showing fronts, eddies, tendrils and interleaving in both data sets, one of the best intercomparisons between seismic and hydrographic profiling to date. The resulting data set is one of only a few suitable for development and testing of techniques for "quantitative inversion" - the inversion of seismic data to obtain detailed oceanographic information such as temperature gradient, temperature, and salinity, a project we hope to begin soon with Mladen Nedimovic and Berta Biescas.
|
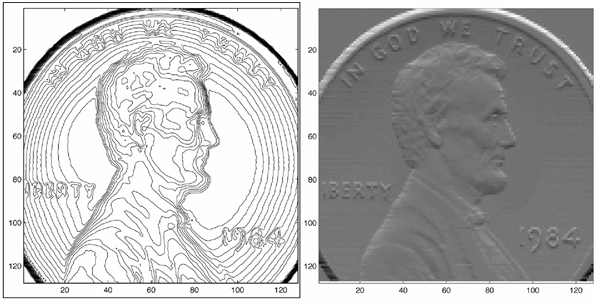 (Left) Contours of thickness of a penny. (Right) Grayscale image of
vertical gradient of thickness. The image at left is the way
oceanographers traditionally plot observations; the image at right,
much richer in detail and looking like a penny illuminated from above,
is analogous to a seismic image. The figures below illustrate the
same point for CTD-derived and seismic images of a real oceanic Meddy,
an eddy containing water from the Mediterranean often found in the
Atlantic.
(Left) Contours of thickness of a penny. (Right) Grayscale image of
vertical gradient of thickness. The image at left is the way
oceanographers traditionally plot observations; the image at right,
much richer in detail and looking like a penny illuminated from above,
is analogous to a seismic image. The figures below illustrate the
same point for CTD-derived and seismic images of a real oceanic Meddy,
an eddy containing water from the Mediterranean often found in the
Atlantic.
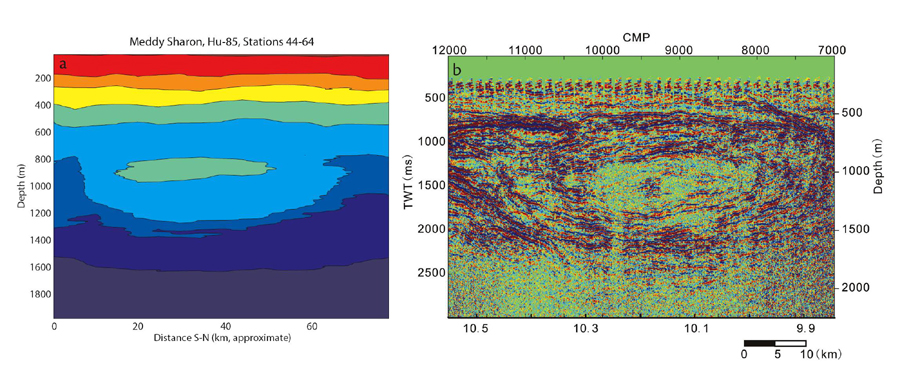 (Left) Conventional contour plot of temperature from a CTD transect of
Meddy Sharon (Armi et al., 1989). The CTD casts have a vertical
resolution of a few meters, but are spaced more than 1.5 km
apart. Contour interval is 2°, with red indicating 18-20°. (Right)
Seismic oceanography image from the IAM5 section on the Iberian margin
during the Iberian Atlantic Margins Project showing a previously
undiscovered meddy, with strong fine-structure reflectors surrounding
the meddy core, and relatively few reflectors in the core. Seismic
images such as this one show structures like meddies because sound
reflects from the fine-scale temperature and salinity variations that
are most intense near their edges. The vertical axis at left is
two-way travel time (TWT).the time required for sound to travel
vertically from the surface to the reflector and back to the
surface. The axis at right is the equivalent depth based on a sound
velocity of 1500 m s-1. Upper axis is the common midpoint (CMP) value,
with 1CMP = 12.5 m. Lower x-axis is west longitude along the nearly
east-west section. (Pinheiro et al, 2009)
(Left) Conventional contour plot of temperature from a CTD transect of
Meddy Sharon (Armi et al., 1989). The CTD casts have a vertical
resolution of a few meters, but are spaced more than 1.5 km
apart. Contour interval is 2°, with red indicating 18-20°. (Right)
Seismic oceanography image from the IAM5 section on the Iberian margin
during the Iberian Atlantic Margins Project showing a previously
undiscovered meddy, with strong fine-structure reflectors surrounding
the meddy core, and relatively few reflectors in the core. Seismic
images such as this one show structures like meddies because sound
reflects from the fine-scale temperature and salinity variations that
are most intense near their edges. The vertical axis at left is
two-way travel time (TWT).the time required for sound to travel
vertically from the surface to the reflector and back to the
surface. The axis at right is the equivalent depth based on a sound
velocity of 1500 m s-1. Upper axis is the common midpoint (CMP) value,
with 1CMP = 12.5 m. Lower x-axis is west longitude along the nearly
east-west section. (Pinheiro et al, 2009)