|
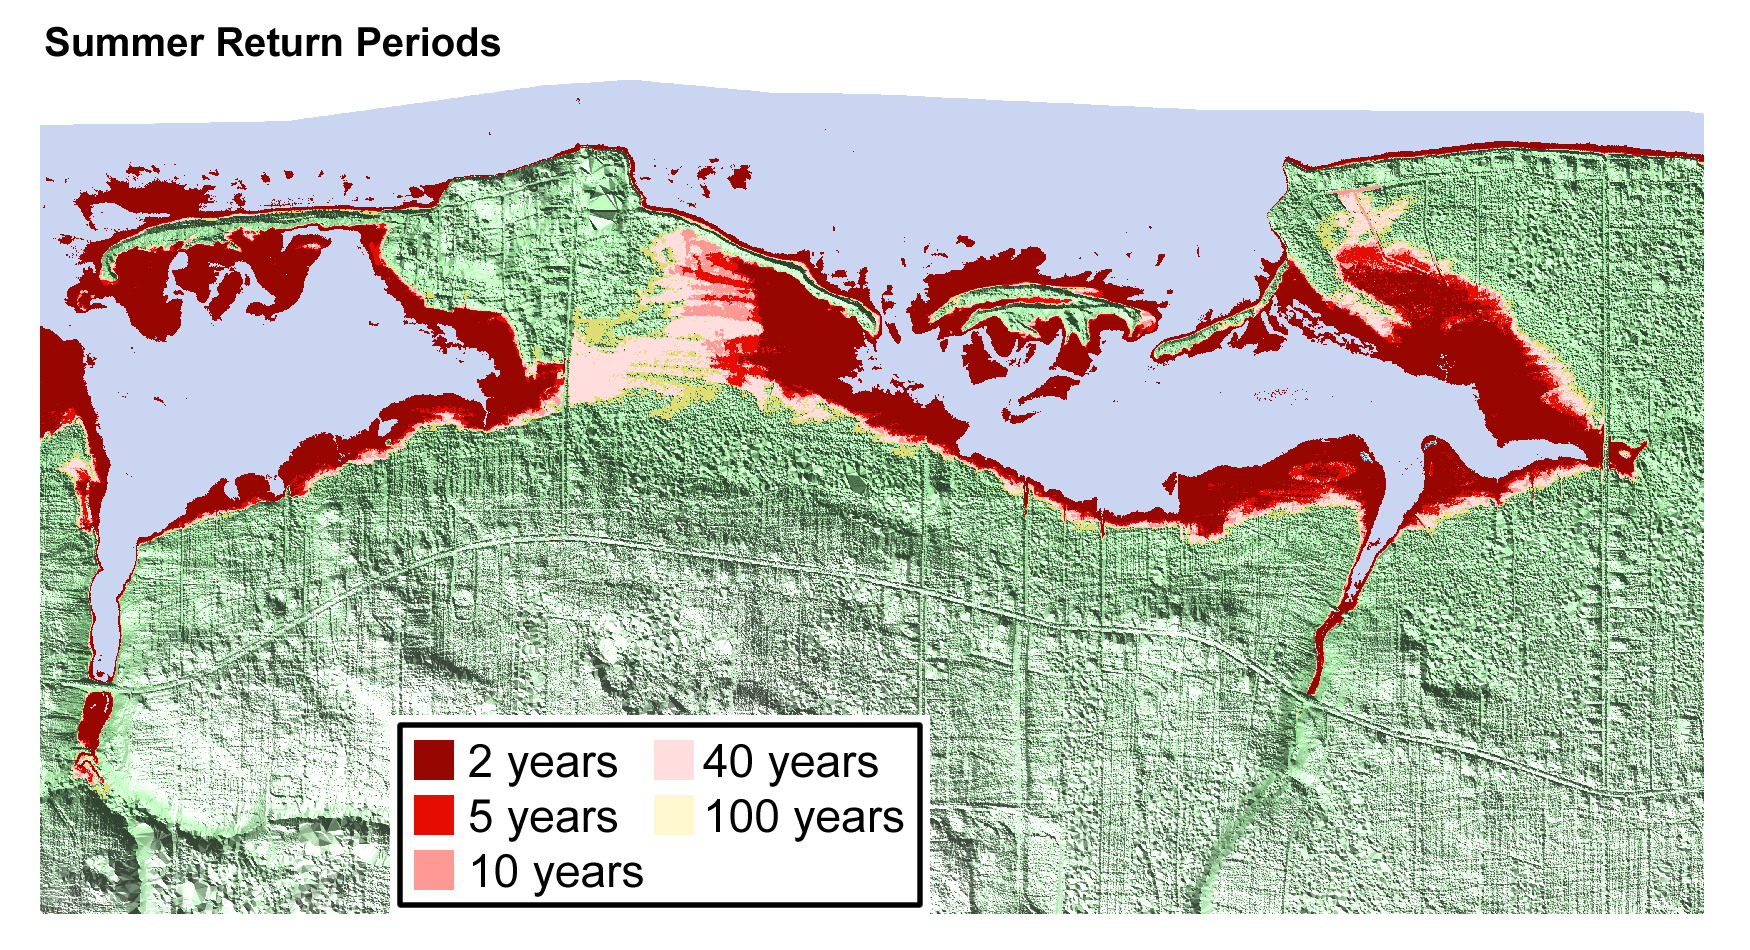
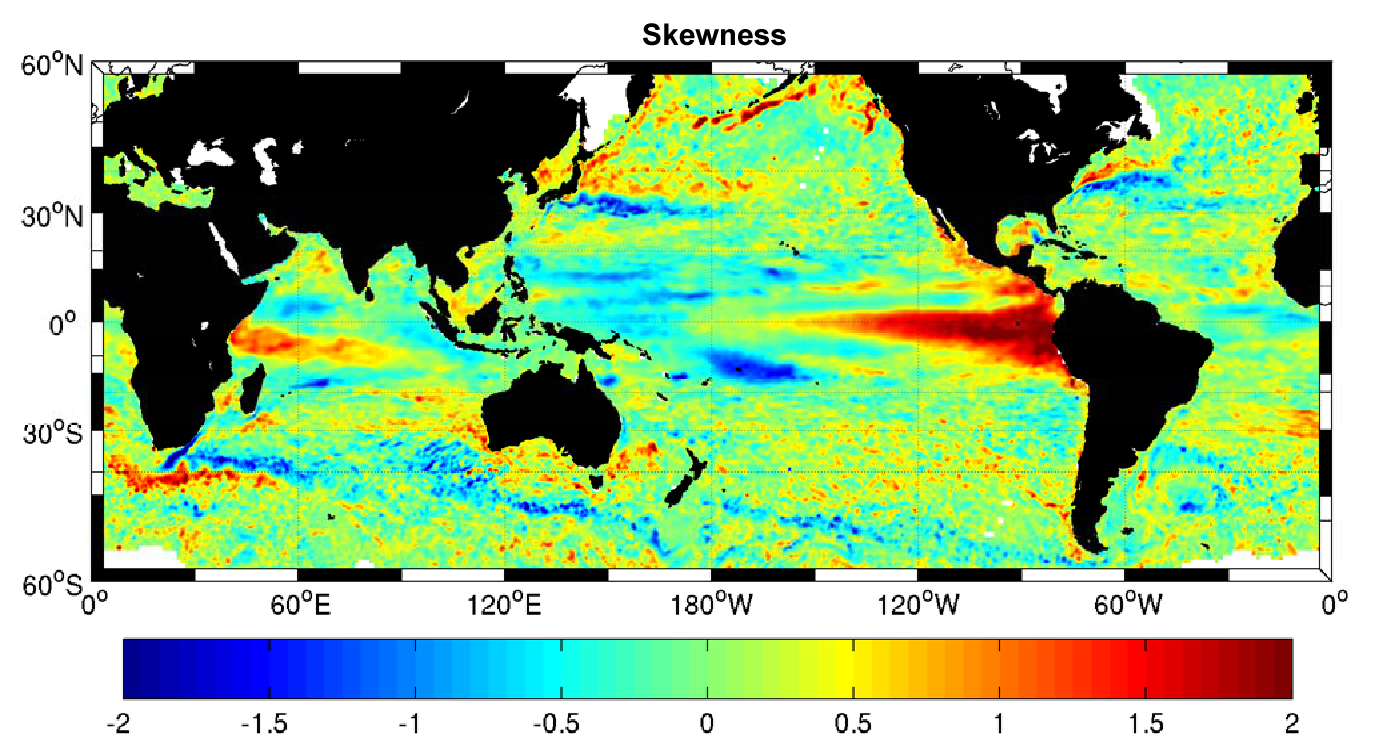
Sea Level Variability: I use both dynamically-based models, and purely statistical techniques, to examine sea level variability measured by coastal tide gauges and altimeters on scales of hours to decades. Bobanović and Thompson (2001) used their storm surge model to show that a complete understanding of variability in the Gulf of St Lawrence must take into account wind forcing all the way from the northern tip of Labrador to the Gulf of Maine. More recently Bernier and Thompson (2005) used a modified version of this model to carry out a 40 year hindcast of surges in the Northwest Atlantic and showed, for the first time, that such a model can provide accurate 40 year return periods of extreme sea levels anywhere in the model domain. Results from this study have been used to assess present and future flooding risk for eastern Canada (Thompson et al., 2002). Using over a decade of global sea level data measured by altimeters, Thompson and Demirov (2005) have recently shown, for the first time, that skewness of sea level variability can be used to (i) identify unstable ocean currents and the dominant polarity of eddy fields, and (ii) test the realism of ocean models.Below are some plots of sea level variance and skewness.
|