Welcome to Bokeh in the Jupyter Notebook!
Bokeh is a Python interactive visualization library for large datasets that natively uses the latest web technologies. Its goal is to provide elegant, concise construction of novel graphics in the style of Protovis/D3, while delivering high-performance interactivity over large data to thin clients.
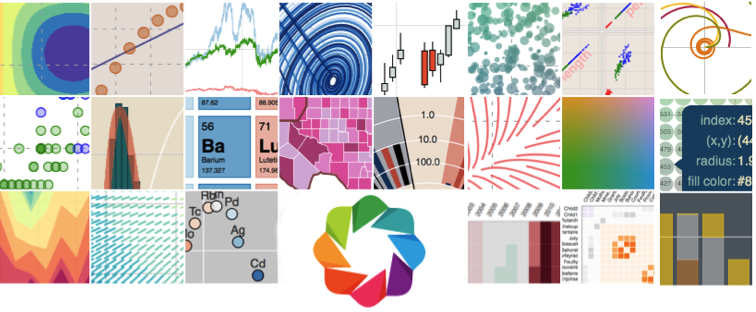
Notebook Gallery
Some examples of Bokeh's interactive plots in IPython Notebooks:
Texas unemployment | Linked brushing | Linked panning | Lorenz | Candlestick | Annular wedge | Rectangular | Glucose | Correlation | Bollinger | Color Scatter
 |
 |
 |
 |
 |
Tutorial
Start with the Tutorial Introduction and jump to any of the specific topic sections from there.
More information
For the full documentation, see http://bokeh.pydata.org/en/latest
To see the Bokeh source code, visit the GitHub repository: https://github.com/bokeh/bokeh
Be sure to follow us on Twitter @BokehPlots, as well as on Youtube and Vine!
Contact
For questions, please join the Bokeh mailing list or visit the Gitter chat room
You can also ask questions on StackOverflow and use the #bokeh tag
For information about commercial development, custom visualization development or embedding Bokeh in your applications, please contact sales@continuum.io
To donate funds to support the development of Bokeh, please contact info@pydata.org
Thanks
Bokeh is developed in part with funding from the DARPA XDATA program. Additionally, many thanks to all of the Bokeh Github contributors.