|
|
Bokeh Tutorial |
00. Introduction and Setup
Table of Contents
Tutorial Overview
The tutorial is broken into several sections, which are each presented in their own notebook:
Appendices
What is Bokeh
Bokeh is a Data Visualization library for
- interactive visualization in modern browsers
- standalone HTML documents, or server-backed apps
- capable of expressive and verstatile graphics
- can handle large, dynamic or streaming data
- available from python (or Scala, or R, or Julia, or...)
And most importantly:
NO JAVASCRIPT REQUIRED 
What can you do with Bokeh
In [1]:
# Standard imports

from bokeh.io import output_notebook, show
output_notebook()
In [2]:
# Plot a complex chart in a single line

from bokeh.charts import Histogram
from bokeh.sampledata.iris import flowers as data

hist = Histogram(data, values="petal_length", color="species", legend="top_right", bins=12)

show(hist)
In [3]:
# Build and serve beautiful web-ready interactive visualizations

import utils
p = utils.get_gapminder_plot()
show(p)
In [4]:
# Create and deploy interactive data applications

from IPython.display import IFrame
IFrame('http://demo.bokehplots.com/apps/sliders', width=900, height=500)
Out[4]:
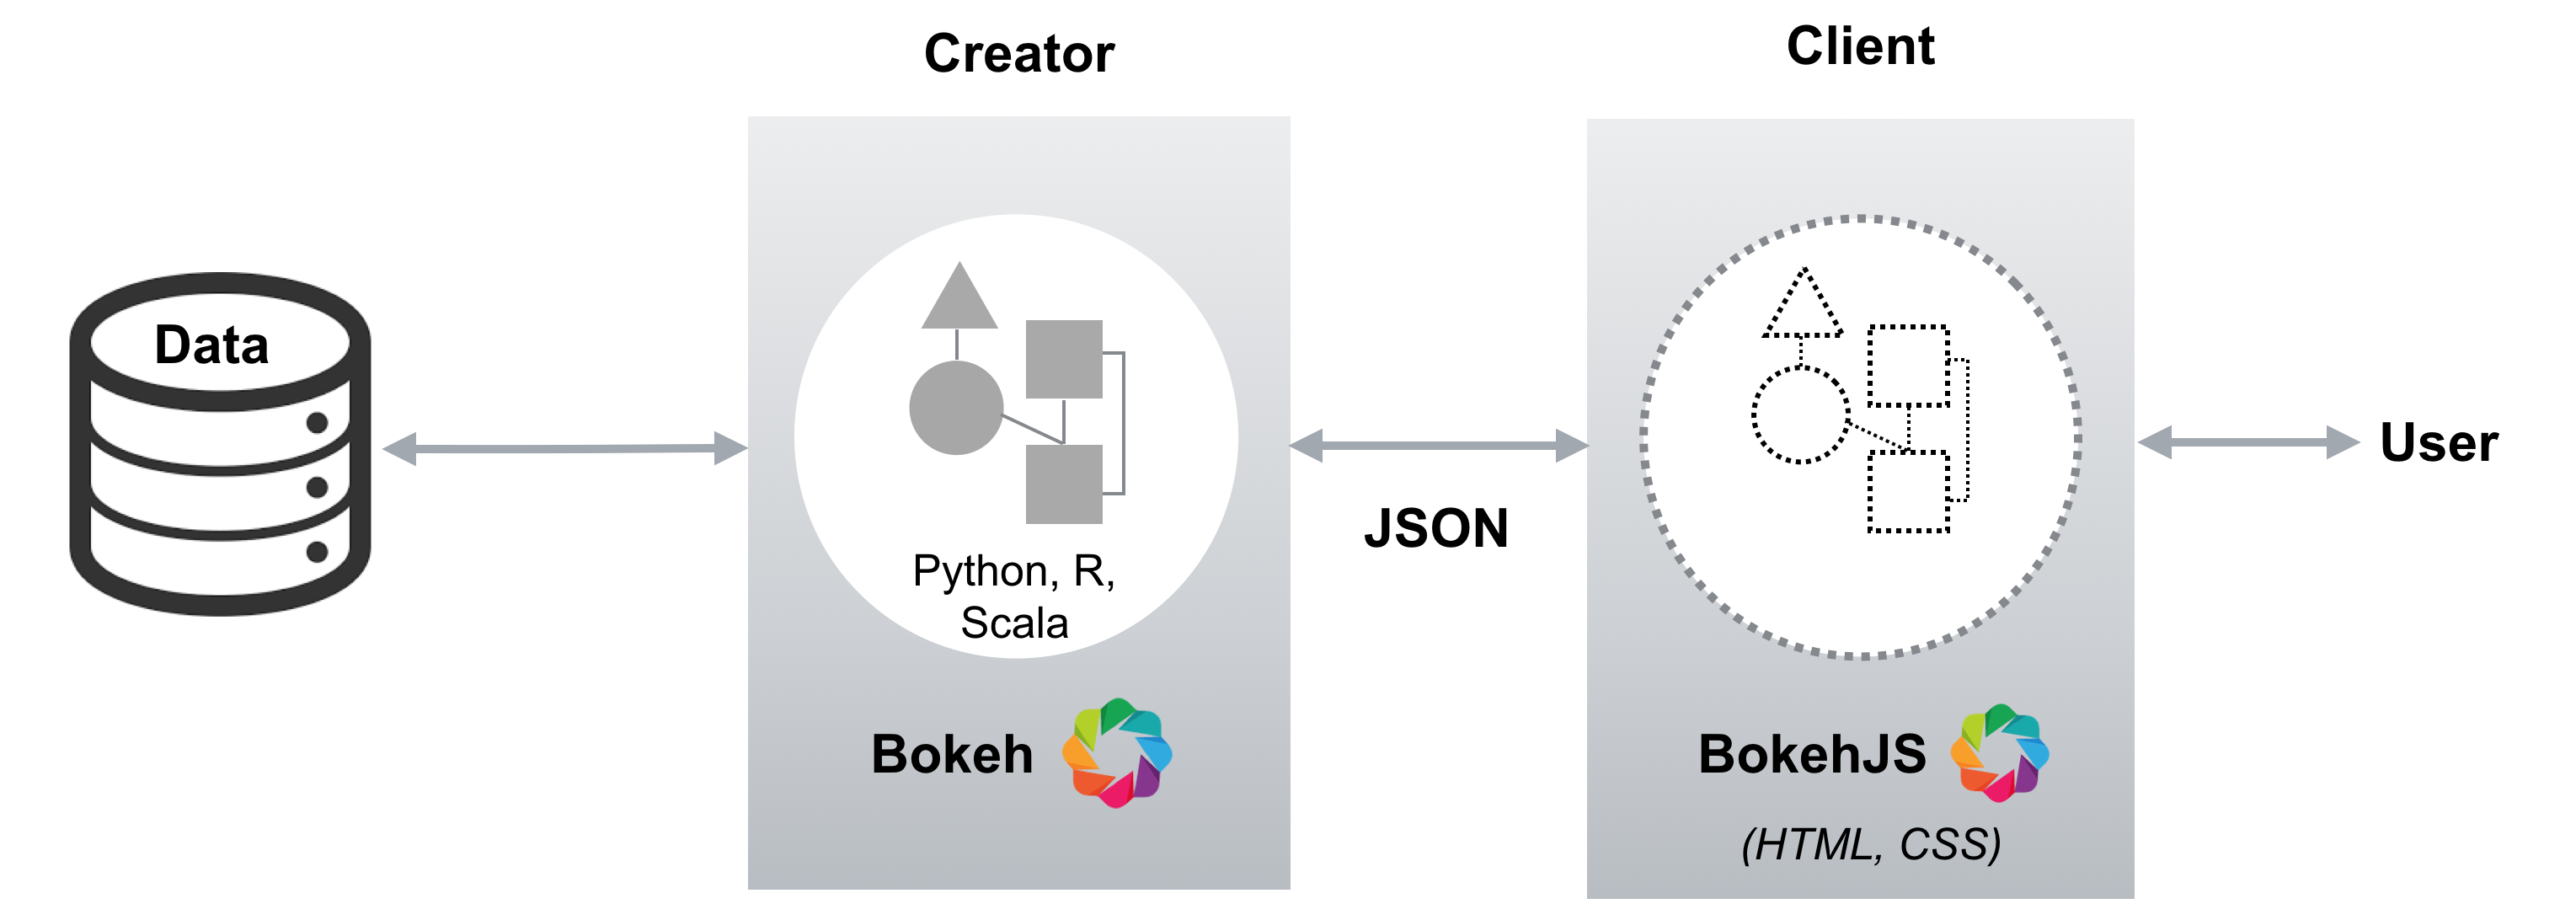
How does it work
Getting set up
In [5]:
from IPython.core.display import Markdown
Markdown(open("README.md").read())
Out[5]:
Setup-test, run the next cell. Hopefully you should see output that looks something like this:
IPython - 5.1.0
Pandas - 0.18.1
Bokeh - 0.12.2
If this isn't working for you, see the README.md in this directory.
In [6]:
from IPython import __version__ as ipython_version
from pandas import __version__ as pandas_version
from bokeh import __version__ as bokeh_version
print("IPython - %s" % ipython_version)
print("Pandas - %s" % pandas_version)
print("Bokeh - %s" % bokeh_version)